🔔 INTELLIGENCE BRIEFING : BITCOIN WEEKLY DRAWDOWN
Classification: PRIORITY | Date: May 18, 2026 | Asset: BTC/USD

VERDICT UPFRONT
This is NOT a random volatility event. The 5% drawdown is market-driven, multi-causal, and traceable to three converging forces: institutional ETF profit-taking, a BOJ hawkish policy pivot triggering yen carry trade unwind fears, and macro uncertainty ahead of PCE data. Structure is bruised but not broken.
FORCE 1: INSTITUTIONAL RETREAT — THE PRIMARY DRIVER
Spot Bitcoin ETFs recorded their largest weekly outflow in months - a net $1 billion for the week ending May 15, 2026, snapping a six-week inflow streak. Outflows accelerated mid-week, with $635 million and $233 million leaving funds on May 13 and 12 respectively. Crypto Times
To understand the magnitude: Wednesday’s $635M single-day exit is the largest since January 29, bringing total redemptions over five trading days to $1.26B. Yet it sits inside a total net inflow base of $58.5 billion since the ETFs launched in January 2024. 99Bitcoins
What’s driving the exits? Institutional investors used the price recovery to partially take profits. Corporate Bitcoin purchases also slowed significantly - down 80% compared to the previous month. Bitcoin Foundation
Additionally, the Coinbase Premium Index has remained in the red since April 28, indicating waning demand from American institutional investors. Futures open interest dropped to $58 billion from this month’s high of $64 billion - a sign investors are closing derivatives positions without opening new ones. Benzinga
The nuanced read: EMJ Capital’s Eric Jackson views the outflows as a “purification” process - transferring ownership from short-term profit-chasers to long-term capital. The next phase could bring steadier demand from capital aligned with a multi-year thesis rather than quarterly returns. KuCoin
FORCE 2: BANK OF JAPAN — THE MACRO WILDCARD
This is the one most traders missed. The $635M ETF exit on May 13 was directly tied to hawkish signals from the Bank of Japan triggering a global risk-off move that cascaded into over $500 million in crypto liquidations. The mechanism is straightforward: the BOJ reinforced its rate-hiking stance, strengthening the yen and forcing institutional desks holding yen-funded risk positions to unwind. CryptoNews.com
The structural setup: BOJ board members called for rate hikes “without hesitation” if Iran-driven energy shock persists. The BOJ held rates at 0.75% at its April 27-28 meeting on a 6-3 vote, with three members pushing for an immediate hike to 1.0%. Swap markets are currently pricing a 74% probability of a BOJ rate hike at the June meeting. Cryptopolitan
The 6-3 vote split is the largest since Governor Kazuo Ueda took the role - indicating that more policymakers are now pushing to raise borrowing costs. The BOJ also revised economic growth projections lower to 0.5% from 1%, while raising its core inflation forecast to 2.8% - the rationale largely tied to war-related energy disruptions through the Strait of Hormuz. CoinDesk
Why this matters to BTC specifically: Yen carry trade unwind. When BOJ hikes, the yen strengthens → investors who borrowed cheap yen to fund risk-asset positions (including crypto) are forced to sell. This same mechanism caused BTC to fall from $65K to $50K in August 2024 in a single week.
The long-term counter-thesis: Arthur Hayes argues that despite raising nominal rates, Japan continues to operate under negative real interest rates - inflation still erodes purchasing power faster than yields compensate savers. His thesis: this creates structural pressure on the yen and incentivizes capital flight into hard assets. “Don’t bet against the Bank of Japan.” CCN
FORCE 3: MACRO CEILING - IRAN + PCE
Bitcoin is dropping today due to rising macro uncertainty and ongoing geopolitical tensions, particularly around the US-Iran situation, which have weakened overall market sentiment. Recent ETF outflows reflect cautious institutional sentiment. Traders are also staying cautious ahead of upcoming PCE inflation data — the next major macro event for rate expectations. Mudrex
TECHNICAL PICTURE
Bitcoin’s descent below $78,000 has formed a textbook bear trap pattern on the daily chart - where price makes a new low only to attract aggressive selling that quickly exhausts. This structure often precedes sharp rebounds as short sellers cover and fresh buyers step in at discounted levels. Pickaxe
Key support sits around $73,700, while $84,500 now acts as the main resistance level.
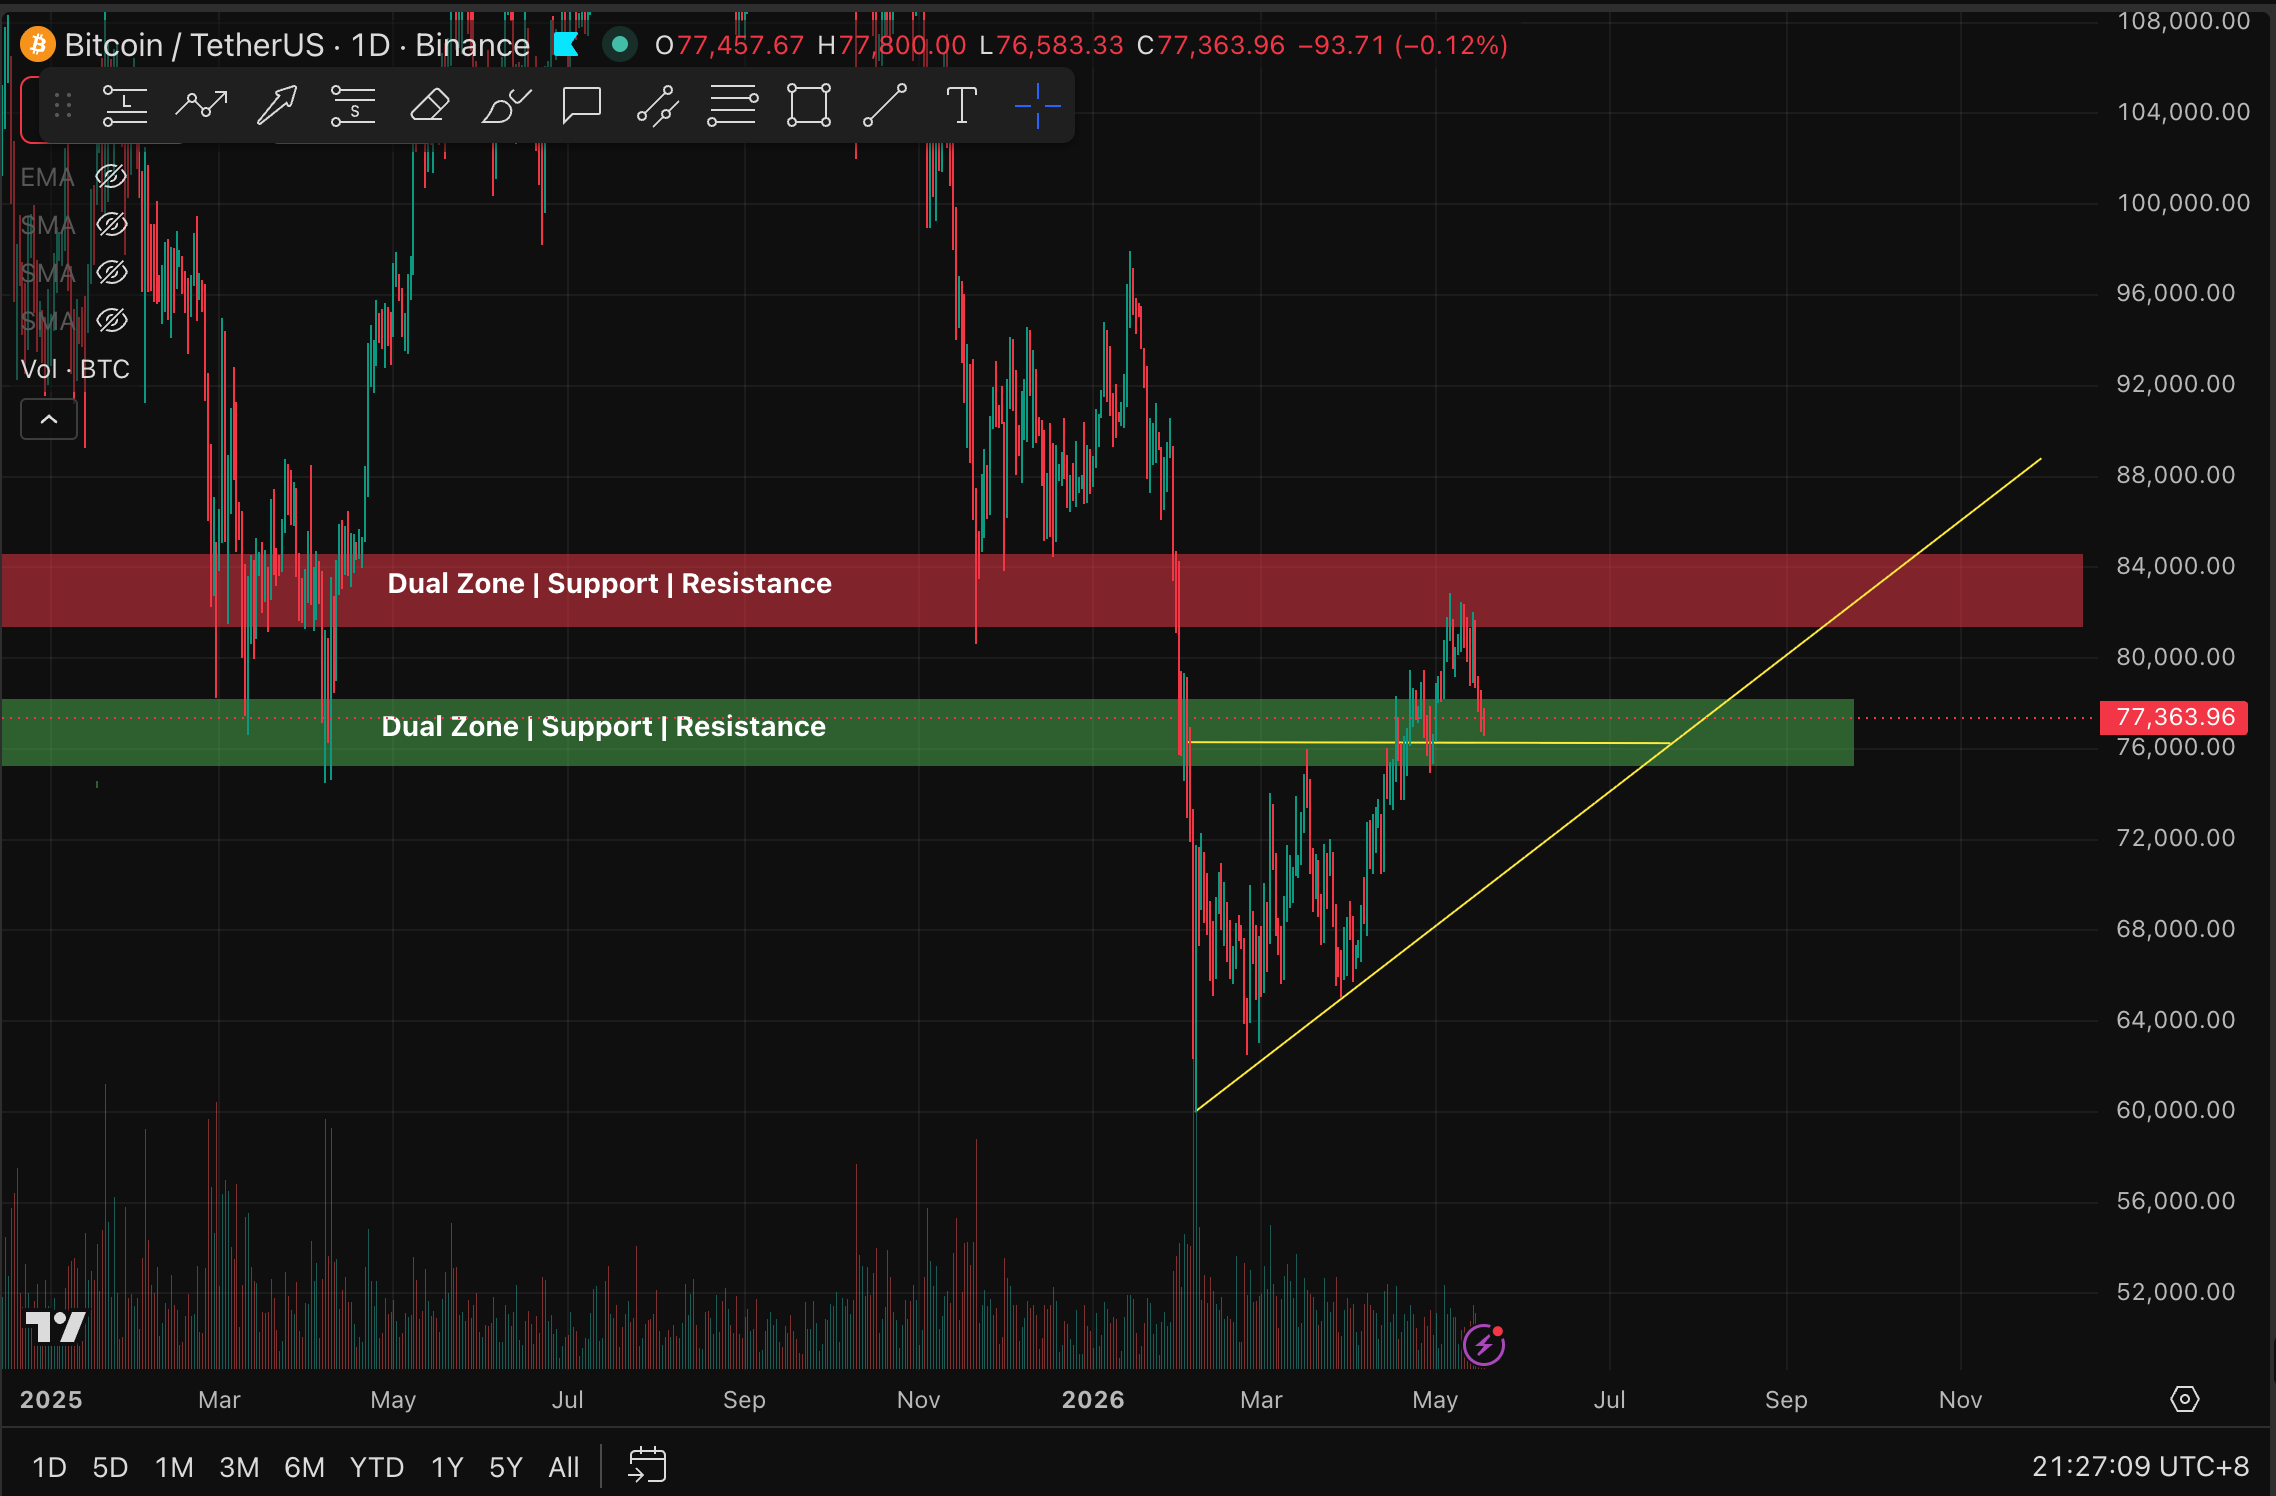
CHART READ
The daily structure tells a clean story. Price is doing exactly what it should do at this level - nothing more, nothing less.
ZONE BREAKDOWN
🔴 Red Zone | $83,000 – $85,000 | Dual Zone: Supply now Resistance
This zone was previously a major support floor during the 2025 bull run. Once broken to the downside, it flipped. Price attempted to reclaim it in the March–April 2026 recovery rally, got rejected, and is now being used by institutions as a distribution shelf. Classic support-becomes-resistance mechanics. Until BTC closes above $85K on daily with conviction, this zone is a ceiling.
🟢 Green Zone | $76,000 – $79,000 | Dual Zone: Active Accumulation
This is where we are right now. $77,410 sits squarely inside this zone. Critically, this same zone acted as resistance on the way up during the 2025 accumulation phase - meaning it has structural memory. Price knows this level. The market is not panicking here. It is parking capital here.
The green zone has been tested multiple times since the November 2025 low. Each test has held. Repeated successful tests of support are not weakness - they are confirmation.
THE ASCENDING TRENDLINE - THE REAL SIGNAL
The yellow trendline drawn from the ~$60,000 November 2025 swing low is the single most important structural element on this chart. It represents the macro higher-low sequence - the backbone of the recovery structure.
Current price sits just above where this trendline intersects the green zone. That is dual confluence support - the trendline and the horizontal zone are both holding at the same coordinate. This is not a coincidence. This is where buyers step in.
📊 MOVING AVERAGES - PLAIN ENGLISH BREAKDOWN
BTC/USDT 1D | 50/100/200 SMA
FIRST, WHAT IS A MOVING AVERAGE?
Think of it like a GPS recalculating your average speed over different time windows. The 50 SMA is your average price over the last 50 days. The 200 SMA is your average over 200 days. The longer the window, the slower it moves, and the more institutional weight it carries.
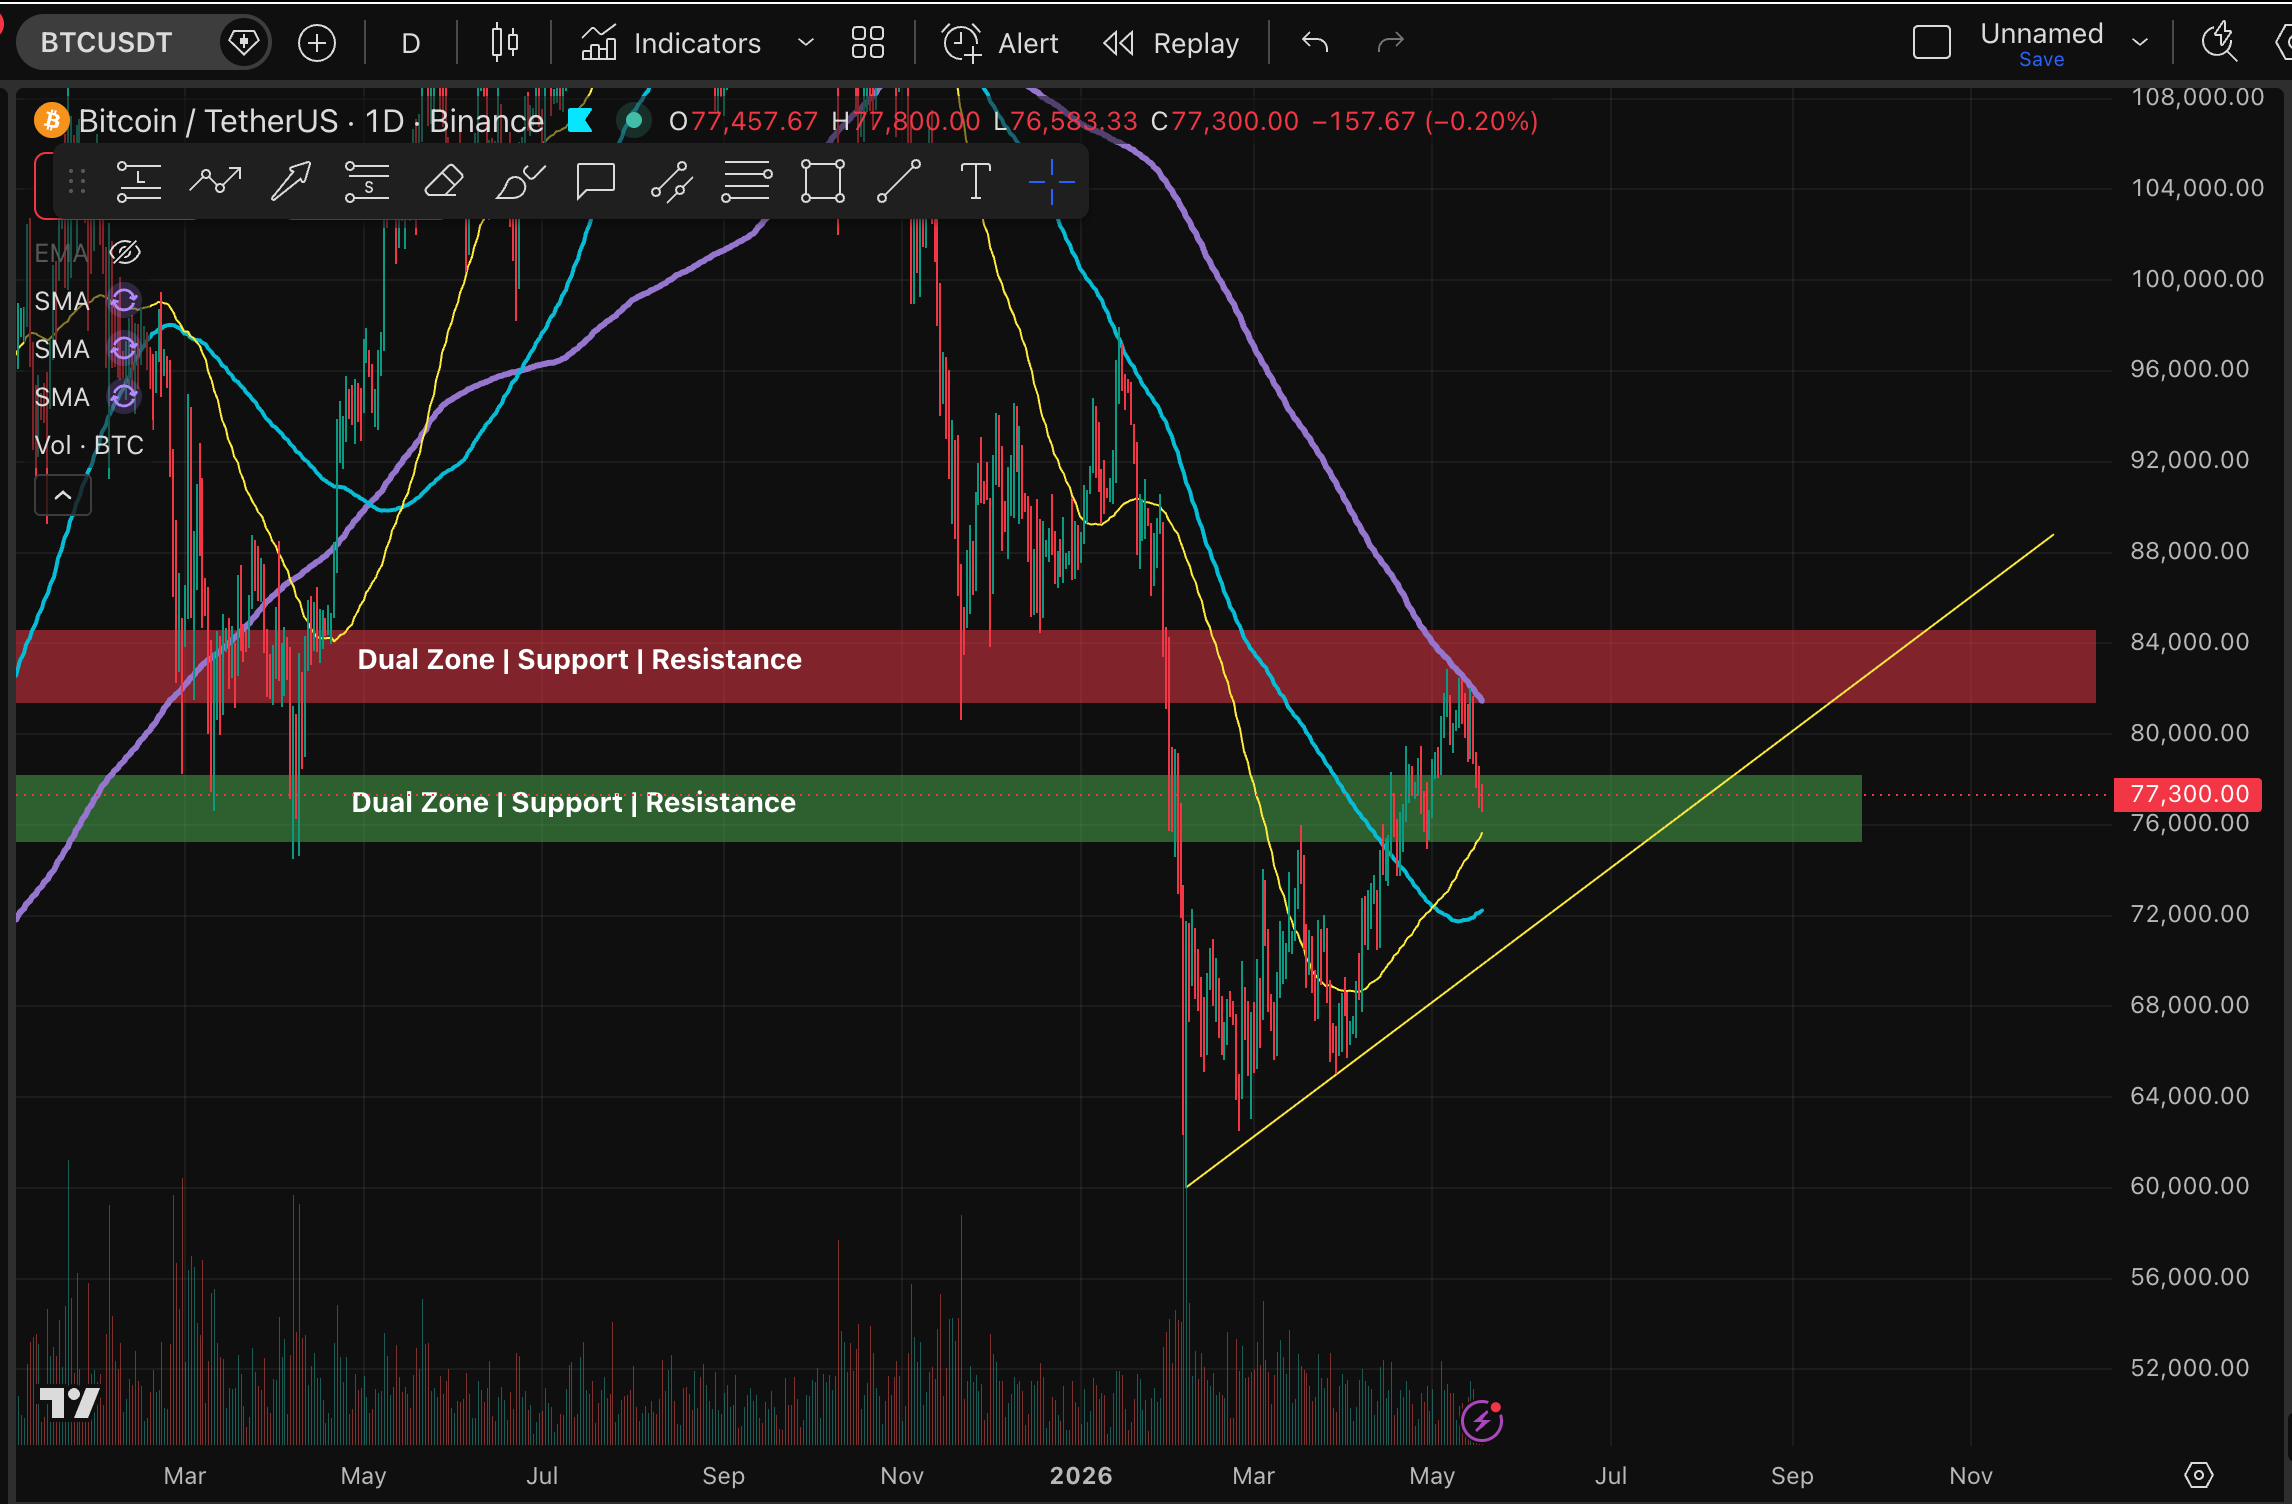
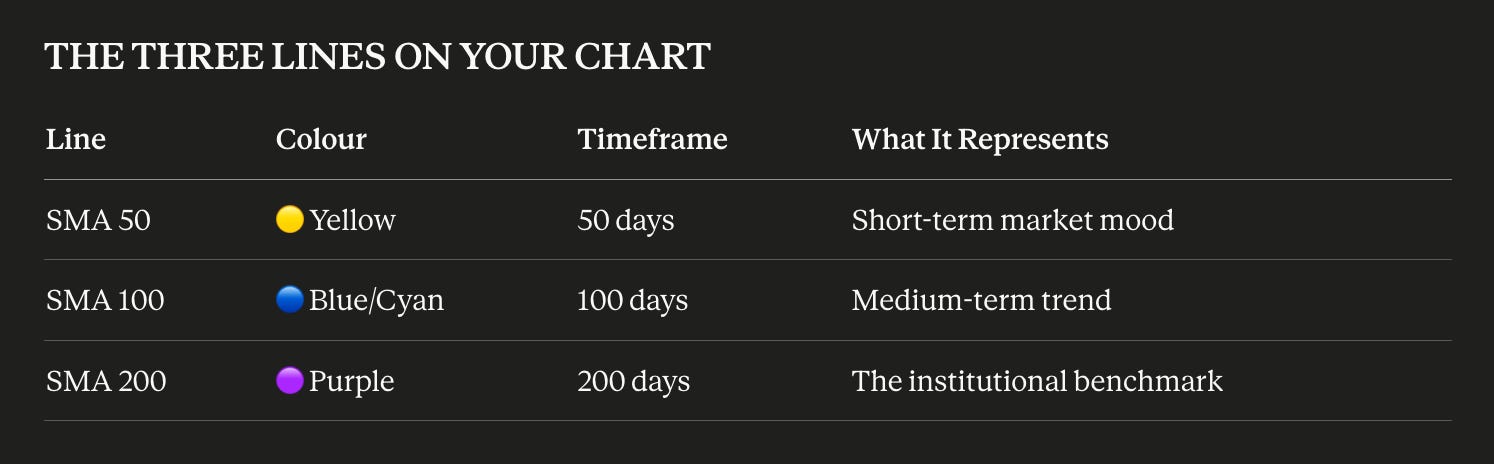
THE STACKING RULE - SIMPLE VERSION
Imagine three runners in a race. When the fastest runner (50) is ahead of the medium runner (100), who is ahead of the slowest (200) - the whole team is moving in the same direction. That’s bullish alignment. Momentum is unified.
When they’re running in reverse order - 200 in front, 50 trailing - the short-term is lagging behind the long-term. That’s bearish alignment. The market is in retreat.
Right now on your chart: The purple (200) is still above the blue (100), which is still above the yellow (50). The team is still in bearish order. But - and this is the critical part - the formation is beginning to shift.
WHAT JUST HAPPENED - THE KEY EVENTS
Event 1: Price launched from $60K and got smacked by the Purple (200 SMA)
The 200 SMA sitting near $84K–$85K acted like a brick wall. This is not surprising the 200 SMA is the most watched line by institutional traders globally. Everyone from Goldman Sachs to retail algos has this line plotted. When price hits it from below, the first rejection is almost always expected. It’s like trying to barge through a door that a hundred people are leaning against from the other side.
The rejection doesn’t mean it won’t break through. It means it needs a running start time, accumulation, and momentum before it can punch through convincingly.
Event 2: The Yellow (50 SMA) is curling up and crossing the Blue (100 SMA)
This is the signal you correctly identified. Here’s the simple way to think about it:
The 50 SMA crossing above the 100 SMA is the market saying: “The recent average price is now higher than the medium-term average price.” In plain English - short-term buyers are outweighing short-term sellers, and the trend is attempting to reverse.
This specific cross is called a bullish crossover and it is an early-stage signal. Not a confirmation - an early warning light turning from red to amber.
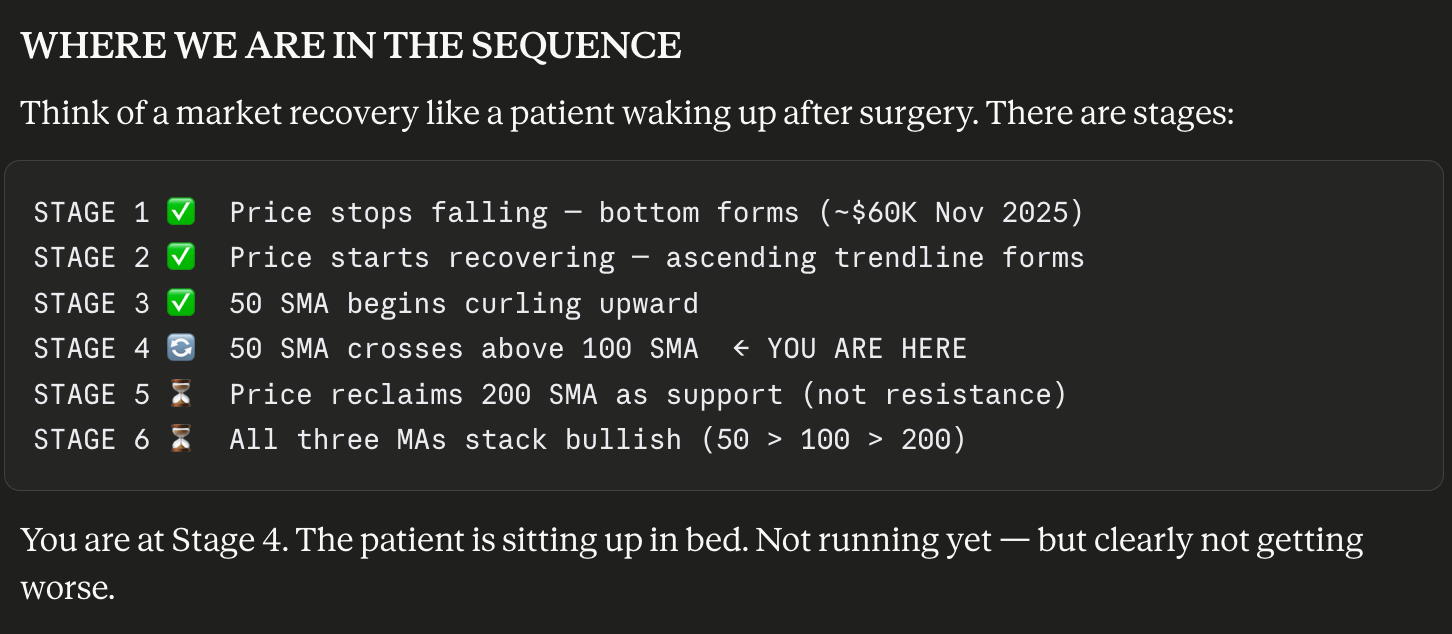
You are at Stage 4. The patient is sitting up in bed. Not running yet - but clearly not getting worse.
THE ONE RISK TO WATCH
A 50/100 crossover can be a false dawn - called a fakeout - especially if macro headwinds (BOJ hike, ETF outflows) push price back below the green zone. If the yellow line rolls back over and falls below the blue again, the recovery signal gets cancelled.
The confirmation you want to see: Yellow (50) staying above Blue (100) while price holds the green zone and pushes back toward the red zone ($83K–$85K). That would be the market building a legitimate case for the 200 SMA retest - and eventually, a breakout above it.
VERDICT - Moving Average Thesis
Early-stage bullish signal. Real but unconfirmed. The structure is transitioning from bearish to neutral. Full bullish alignment - all three MAs stacked in ascending order with price above all of them - is still weeks to months away. But the direction of travel is correct. The 50 crossing the 100 is the first domino. Watch for the price to defend the green zone while that cross holds. That’s your thesis building in real time.
PALANTIR CONCLUSION
The structure is intact. The infrastructure is built. The participants are positioned.
What Bitcoin is waiting for is not adoption; that chapter is written. What it’s waiting for is the moment the cost of NOT owning it becomes more obvious than the risk of owning it.
Every macro stress event, whether it’s a bond crisis in Tokyo, a currency collapse in Ankara, or an inflation print in Washington, chips away at that equation. The institutions aren’t building all this infrastructure to watch it sit idle. They’re building it because they know which way this goes.
Your job as an investor isn’t to predict the catalyst. It’s to be positioned before it arrives.